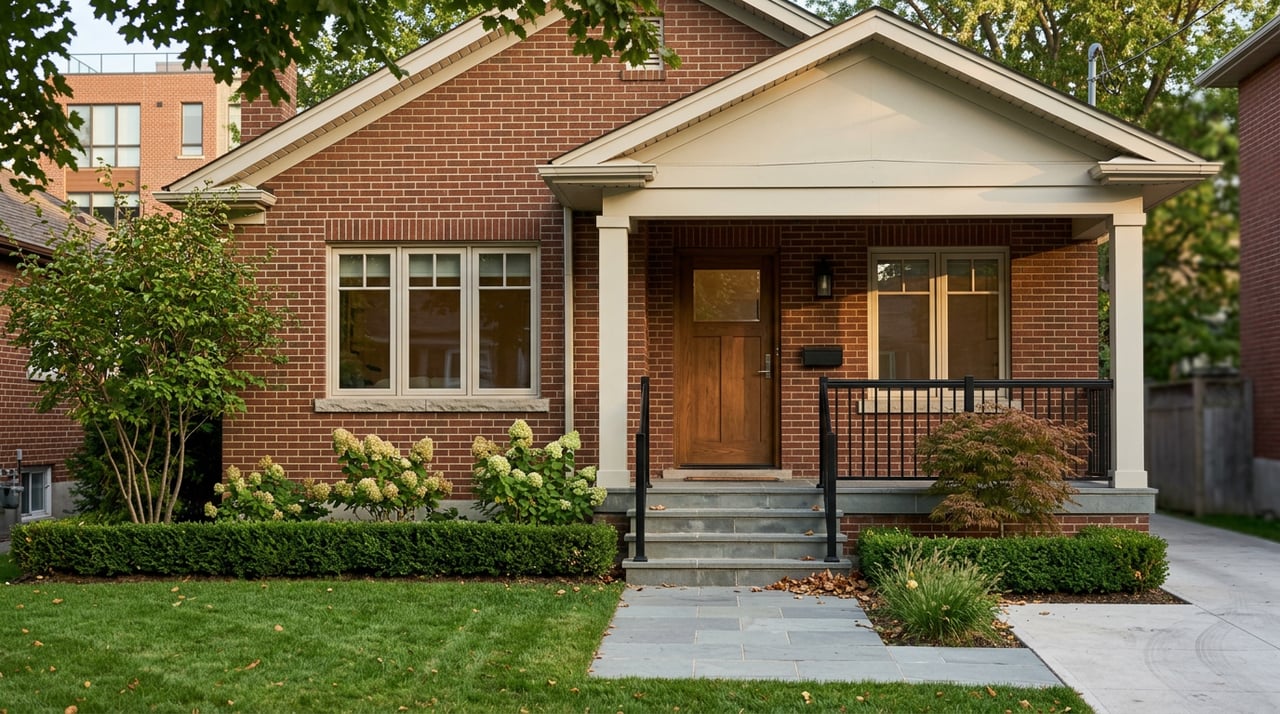
Wondering what price will attract strong offers for your Oakville home right now? You’re not alone. With more listings on the market and buyers watching rates closely, setting the right number can feel tricky. In this guide, you’ll get a clear, step-by-step plan grounded in local board data so you can price with confidence and move forward without guesswork. Let’s dive in.
Start with today’s market snapshot
As of the Oakville, Milton & District Real Estate Board’s February 2026 release (published March 4, 2026), the average single-family price in Oakville was $1,751,327, while Oakville townhouses and condos averaged $822,158. Across Halton, the single-family average was $1,444,840. Homes were taking longer to sell at about 35 days on market, and the board noted that most homes were selling below asking. You can see these figures in the board’s February report for full context and definitions. Review OMDREB’s February 2026 market report.
Different trackers sometimes publish different averages for Oakville because they use rolling windows or different mixes of property types. For example, some local snapshots showed overall averages in the low-to-mid $1.3M range during February 2026. That is a methodology effect, not a contradiction. This is why the benchmark price (MLS HPI) or a carefully chosen set of comparable sales is better for trends than a simple average. See an example of how rolling snapshots can differ on this Oakville market overview.
Zooming out, early 2026 in the GTA has been moving toward a more balanced market. Buyers have more time to compare, and price strategy matters. You can see the regional tone in TRREB’s Market Watch and affordability context in the Bank of Canada’s policy rate, which stood at 2.25% after its January 28, 2026 decision. Read the Bank of Canada’s Jan 28, 2026 statement.
Choose the right pricing metric
Averages can swing when more detached homes sell one month and more condos sell the next. To keep your pricing objective:
- Average price: Adds up all sales and divides by the count. Skews with outliers and changing mix.
- Median price: The middle sale. Less sensitive to outliers.
- MLS HPI (benchmark): Tracks the value of a “typical” home and controls for changing sales mix. Often best for trend direction.
When you describe trend or set expectations, prefer the benchmark or median over a simple average. You can learn more about how these metrics work on CREA’s stats portal.
Oakville micro-markets vary by street
Oakville is not one market. Waterfront and Old Oakville pockets often behave very differently from areas like West Oak Trails, Joshua Creek, or newer subdivisions. TRREB’s community reports show wide gaps in average and median prices, plus different days on market by area. That is why a street-level comparative market analysis (CMA) is essential. Explore neighbourhood-level patterns in TRREB’s Oakville community report (Q3 2025), then focus on your immediate micro-area with very recent comps.
A step-by-step pricing plan
Step 0: Date-stamp your context
Start every pricing conversation with the latest data. For example: “Based on OMDREB’s February 2026 report, Oakville’s single-family average was $1,751,327, with most homes selling below asking.” This anchors your decision to a point in time and frames next steps.
Step 1: Build hyper-local comps
Pull sales from the last 60 to 90 days in your micro-neighbourhood. Prioritize:
- The same property type and similar size and age.
- A similar price band and lot type.
- Both closed sales and the current competition (actives and pendings) to read demand and supply.
TRREB’s community tables can help you set neighbourhood bands, but your CMA should drill down to the street level. If there are few recent sales, expand the window carefully and note how each older comp differs.
Step 2: Make objective adjustments
Once you select comps, apply systematic plus or minus adjustments so you are comparing apples to apples. Common items to review with your agent or appraiser:
- Lot size and usability, frontage, and any waterfront influence.
- Finished basement area and ceiling height.
- Kitchen and bath updates within the last 5 to 10 years.
- Number of bathrooms and functional bedroom count.
- Garage type and parking.
- Energy or rooftop upgrades, windows, roof, HVAC, and insulation.
- Legal suites or income potential.
- Overall age, condition, and recent permits.
Document each material difference with a dollar or percentage estimate so you can explain the final range with confidence.
Step 3: Read market heat before you pick a posture
Market balance should shape your pricing stance. Key diagnostics:
- Sales-to-new-listings ratio (SNLR). CREA and major boards often classify 40 to 60 percent as balanced. Above that skews seller-favouring, below that skews buyer-favouring. See CREA’s market-balance guidance.
- Months of inventory (MOI). Low MOI can support firmer pricing; higher MOI calls for sharper positioning.
- Days on market (DOM). Rising DOM suggests buyers have time to compare.
- Sale-to-list ratio in your micro-area. If most sales are below ask, plan for negotiation.
In early 2026, days on market in Halton lengthened and many homes sold below list, so accurate positioning is critical.
Step 4: Set a price range and a negotiation plan
Price is a strategy, not just a number. With your agent, define three figures:
- Target: A best realistic outcome if the market responds strongly.
- Likely: The most probable sale price based on comps and current competition.
- Floor: Your walk-away number.
In a balanced or cooler pocket, include a 1 to 3 percent negotiation buffer because sale-to-list ratios often trend below 100 percent. Align your buffer with what nearby sales actually achieved over the last 60 to 90 days.
Step 5: Watch the first 14 days and be ready to act
The first two weeks typically generate the most traffic and agent interest. Track showings, online views, and feedback daily. If you see low activity and consistent price feedback after 7 to 14 days, consider a modest staged adjustment of about 1 to 3 percent. If activity is strong but offers are weak on terms, improve presentation, tighten your marketing, or explore buyer incentives before making a larger cut.
Step 6: Document everything
Keep screenshots of your CMA, comp details, and showing logs. Date-stamp market stats you quote in your listing and in your decision notes. This makes later adjustments faster and more objective.
Pricing tactics that work in Oakville
- Price to the search band. Buyers filter by round numbers. If you price at 1,499,000 instead of 1,505,000, you capture both the 1.25 to 1.5 and the 1.5 to 1.75 million search brackets, which can increase views.
- Launch with strong media. Pro photos, accurate floor plans, and measured square footage can boost engagement during the critical first two weeks.
- Consider a pre-listing inspection. This reduces surprises and can support a firmer final price, especially for higher-end or unique homes.
- Avoid “test the market” overpricing. Late, large price cuts often lead to weaker outcomes than accurate pricing from day one. Plan your range, then commit to it with timely check-ins.
Quick seller checklist for next month
- Pull the latest local board release and quote it by month and year. Start with OMDREB’s February 2026 report.
- Ask for a 60 to 90 day CMA focused on your street and price band.
- Compare solds, actives, and pendings, noting DOM and sale-to-list ratios.
- Prep the home before going live: staging, pro photos, light repairs.
- Set your target, likely, and floor prices, plus a 14-day review plan.
When to get an appraisal
If your home is unique, in an estate, or likely to trade well above local norms, a professional valuation can be wise. Appraisals come with a cost and provide an opinion of value on a specific date, which is useful for mortgage, legal, or tax purposes. For most listings, a well-built CMA plus board stats are sufficient to set a market-aligned list price.
Your next step
You deserve a clear plan and a confident result. If you’re thinking about listing in Oakville, let us build a data-backed pricing strategy and a launch that maximizes your first two weeks on market. Start with a conversation and a custom valuation from OwnIt.ca.
FAQs
How should I price my Oakville home in early 2026?
- Use OMDREB’s February 2026 data as context, build a 60 to 90 day street-level CMA, set a target-likely-floor range, and review results after 7 to 14 days.
What metrics matter most when setting list price?
- Lean on benchmark price or median for trends, then comps, DOM, SNLR, months of inventory, and recent sale-to-list ratios in your micro-neighbourhood.
Why do different sites show different Oakville averages?
- Methodology and mix of sales vary. Rolling windows and detached vs condo proportions change the average, which is why HPI or median is often better for trends.
How fast should I adjust price if interest is low?
- If showings and feedback are weak after 7 to 14 days, consider a modest reduction of about 1 to 3 percent and refresh marketing if needed.
How do rates impact my pricing outcome in Oakville?
- The Bank of Canada’s 2.25 percent policy rate as of Jan 28, 2026 shapes mortgage costs and buyer capacity, which affects negotiation room and time on market.
When is a professional appraisal worth it?
- Consider it for estates, unique or luxury properties, or when you need an independent valuation for legal or mortgage purposes; otherwise, a strong CMA usually suffices.